Evidence from Ghana, Nigeria, Kenya, Egypt and South Africa

By Emmanuel Edudzie
Executive Director, YOTA
Summary
Most young workers in these five countries hold jobs that generative AI barely touches today. The exposure that does exist falls on office jobs, on young women and on workers without formal protection. Senegal is excluded because its survey does not classify most occupations; it appears in the unemployment analysis of the third note in this series.
- Exposure is low overall. Between 49% (South Africa) and 85% (Kenya) of employed 15–24-year-olds work in farming, crafts, machine operation, elementary work or management, where exposure is minimal or absent.
- It sits in office work. Clerical support is by far the most exposed occupation group in the ILO’s 2025 index.
- South Africa is the outlier. Clerical jobs employ 15% of young workers there, against fewer than 3% in the other four countries and 10.5% of South Africans aged 25+.
- Young women are more exposed than young men in all five countries. In South Africa, 27% of employed young women work in clerical jobs; in Egypt, 10%.
- Exposed young workers are the least protected. 85% of young clerical workers in Ghana and 93% in Nigeria are informally employed, against 56% and 54% of older clerical workers.
Why this matters
The ILO estimates that 6.1% of jobs held by 15–29-year-olds worldwide are in occupations highly exposed to AI-related change (ILO, 2026). It also reports that clerical and administrative roles, long a foothold for young workers, are shrinking.
That global figure says little about Africa, where most young people work informally, in farming or in trade. The ILO’s 2025 index finds that exposure falls with national income: 11% of employment in low-income countries is in an exposed occupation, against 34% in high-income countries (Gmyrek et al., 2025).
This note asks which young people in five African labour markets hold exposed jobs today. Exposure measures what generative AI could do to a job’s tasks; it is not a forecast that the job will disappear.
Data and method
The analysis joins two ILO sources for Ghana (2025), Nigeria (2025), Kenya (2021), Egypt (2024) and South Africa (2025), the latest year with a full occupation breakdown in each.
- Who works where. ILOSTAT survey estimates of employment by sex, age (15–24 and 25+) and the nine major occupation groups of ISCO, the international classification, plus informal employment on the same breakdown.
- How exposed each occupation is. The ILO’s 2025 index scores 427 detailed occupations on how far generative AI could automate their tasks. It places each in one of four exposure gradients (4 is the highest), “minimal exposure” or “not exposed”.
Youth data are published only for the nine major groups, so the groups are placed in four tiers by their exposure profile:
| Tier | Occupation groups | Exposure profile |
|---|---|---|
| High | Clerical support | most occupations in the two highest gradients |
| Mixed | Professionals; technicians | finance, ICT and media highly exposed; teaching and health not |
| Partial | Service and sales | the main trade jobs sit in Gradients 1–2 |
| Low | Farming, crafts, machine operators, elementary work, managers | mostly minimal or no exposure |
Senegal was dropped because most occupations in its survey are unclassified. South Africa reports the older ISCO-88 groups, which line up closely with the current ones.
Most young workers are in jobs with little exposure
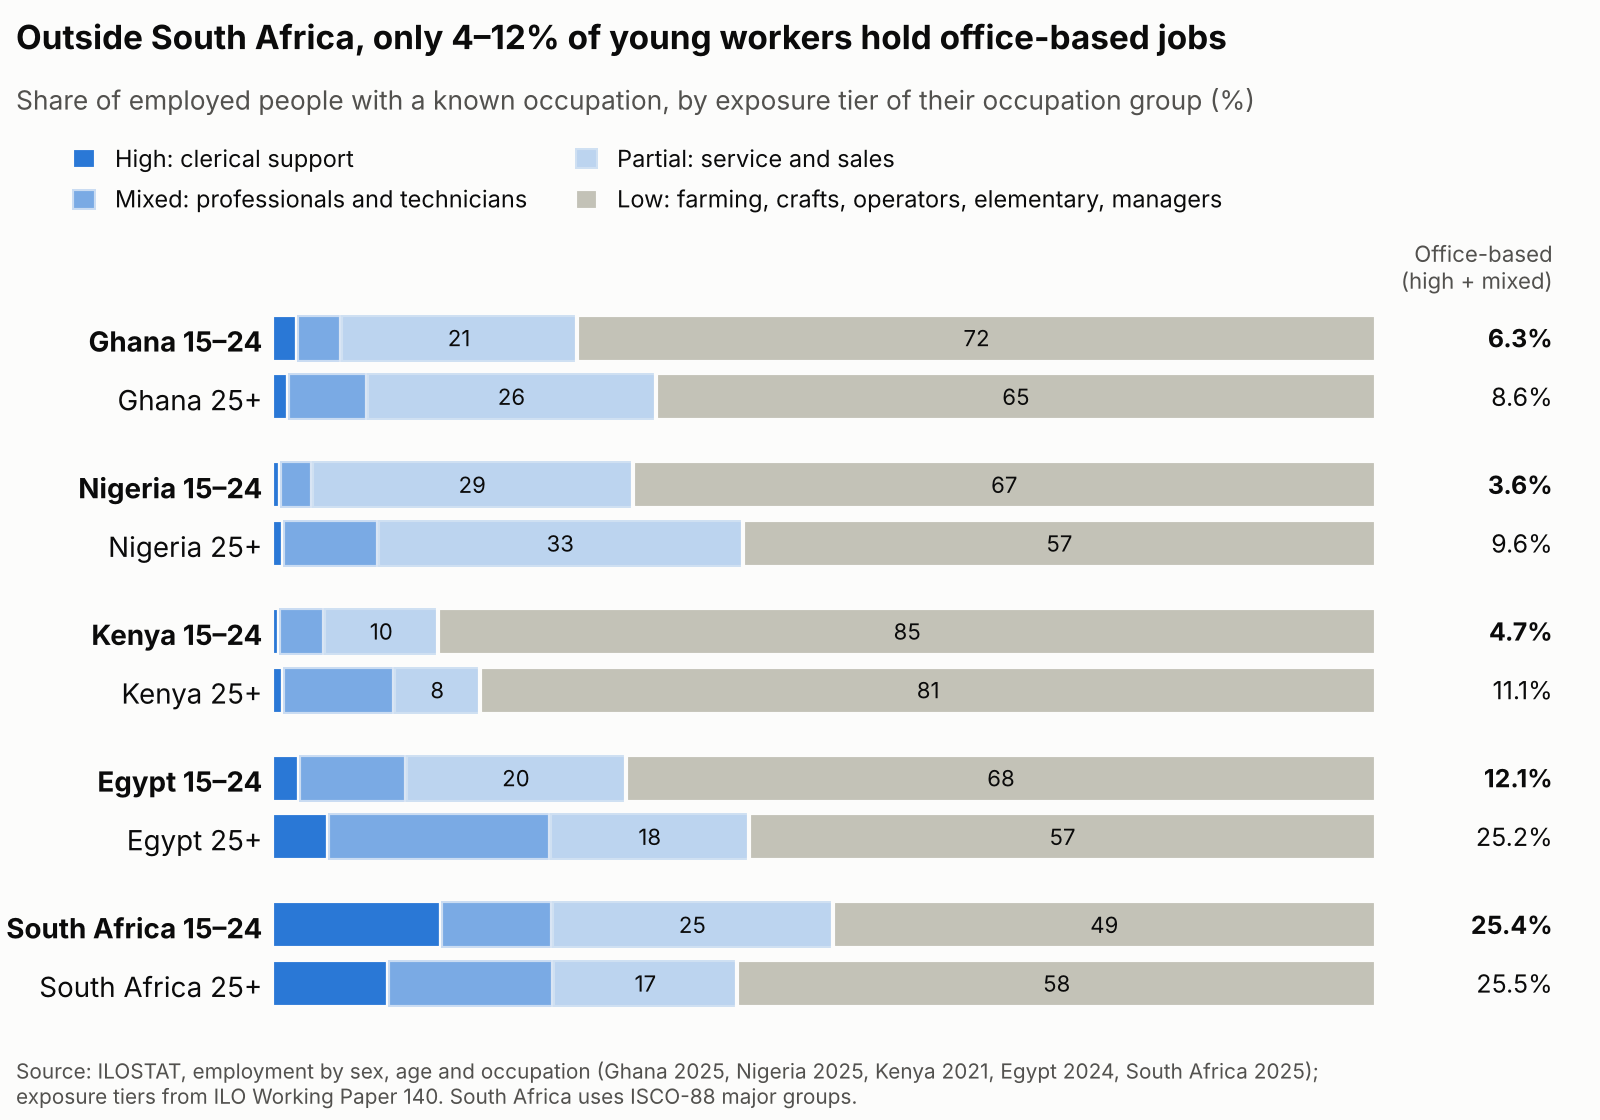
Young workers are less likely than older workers to hold office-based jobs in four of the five countries; in South Africa the shares are almost identical. The gap is mostly professional and technical work, which usually needs qualifications many 15–24-year-olds are still completing.
Exposure sits in office work, a first rung into formal jobs
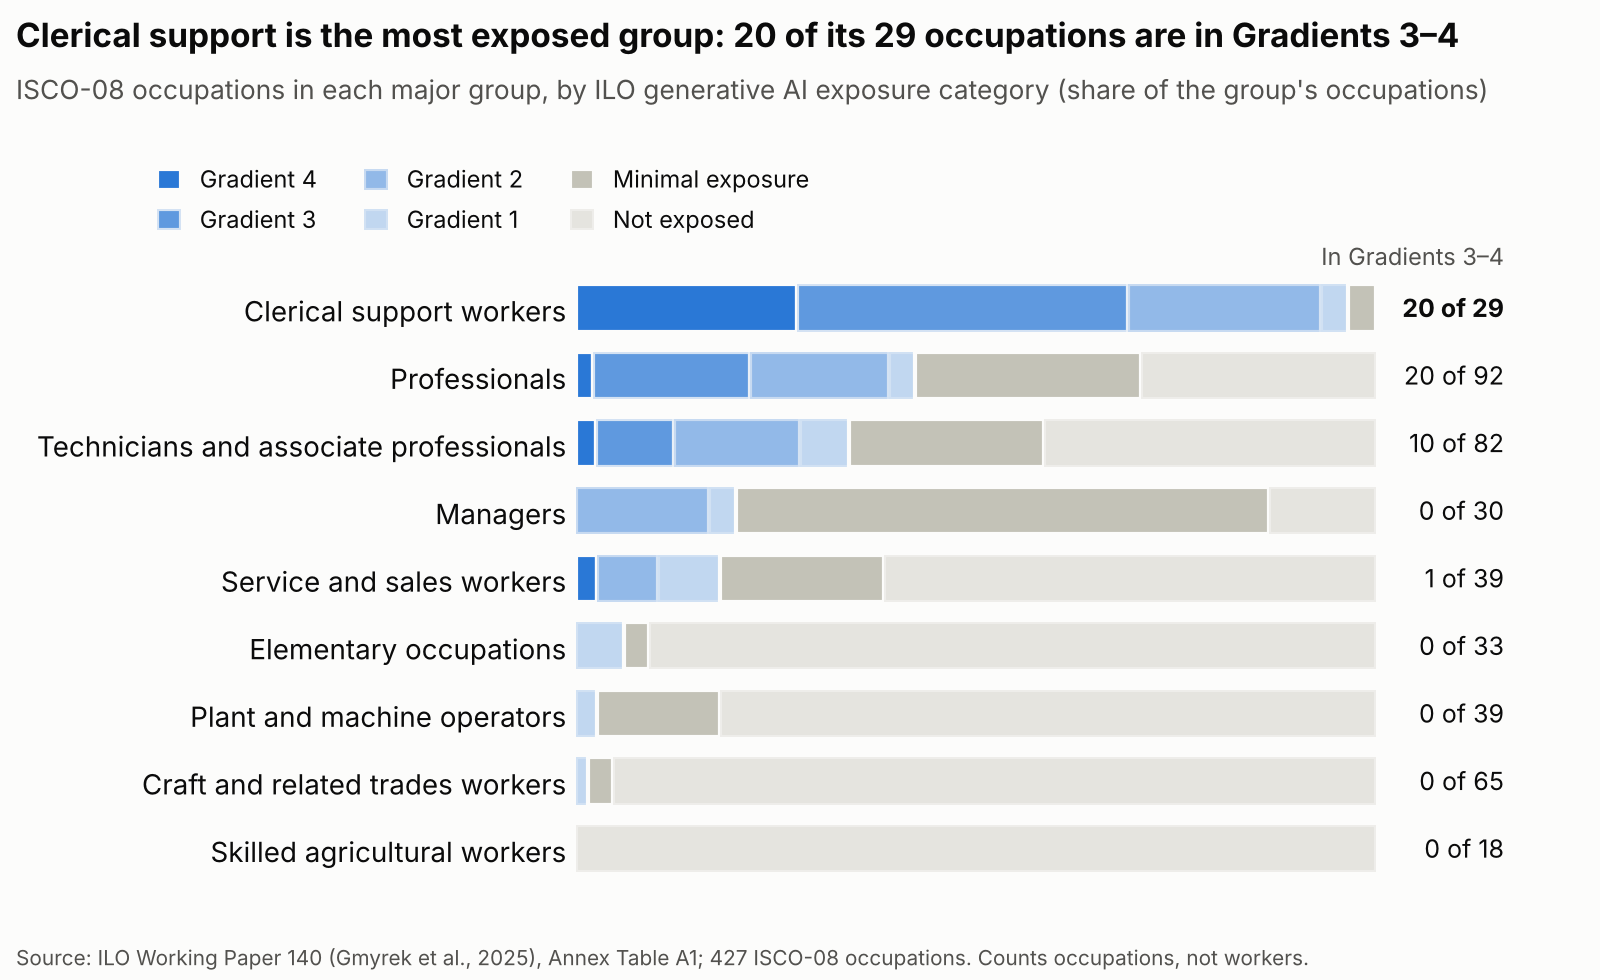
Among professionals and technicians, finance, ICT, media and administrative occupations are highly exposed, while teaching and health occupations are not. Common trade jobs (market selling, shop selling, shopkeeping) sit in Gradients 1–2: some of their tasks are exposed, most are not.
Clerical jobs are the one tier where young workers are over-represented in two countries: 2.2% of young workers against 1.4% of older workers in Ghana, and 15.3% against 10.5% in South Africa. The ILO describes clerical and administrative roles as a long-standing foothold for young workers.
Young women hold more of the exposed jobs
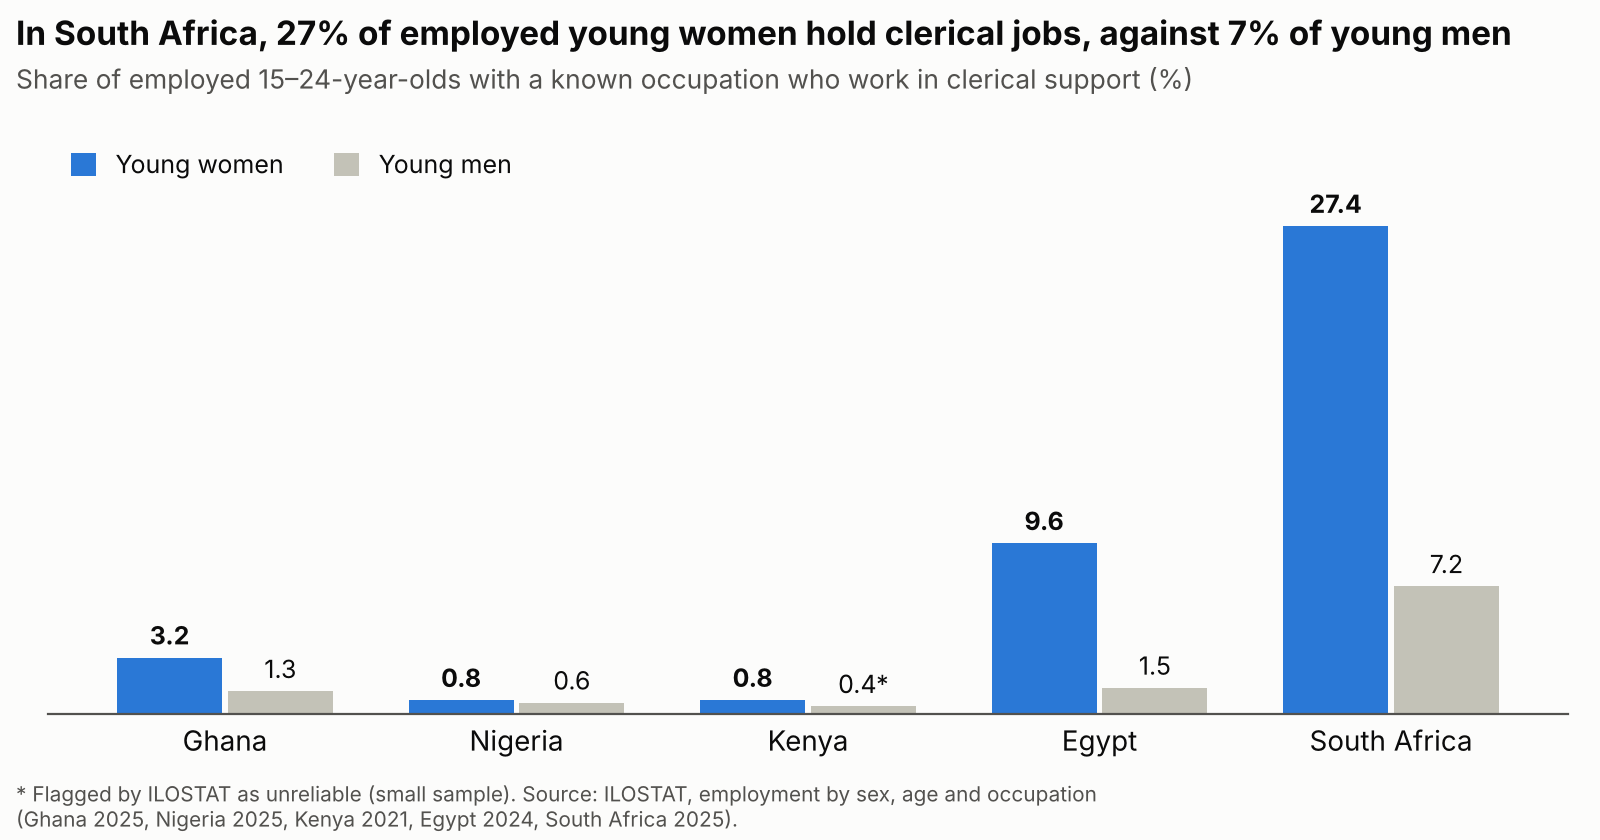
Young women are more likely than young men to work in clerical jobs in all five countries, echoing the ILO’s global finding that women’s jobs are more exposed. The gap extends to professional and technical work: in Egypt, 44% of employed young women hold clerical, professional or technical jobs, against 8% of young men.
Exposed young workers are the least protected
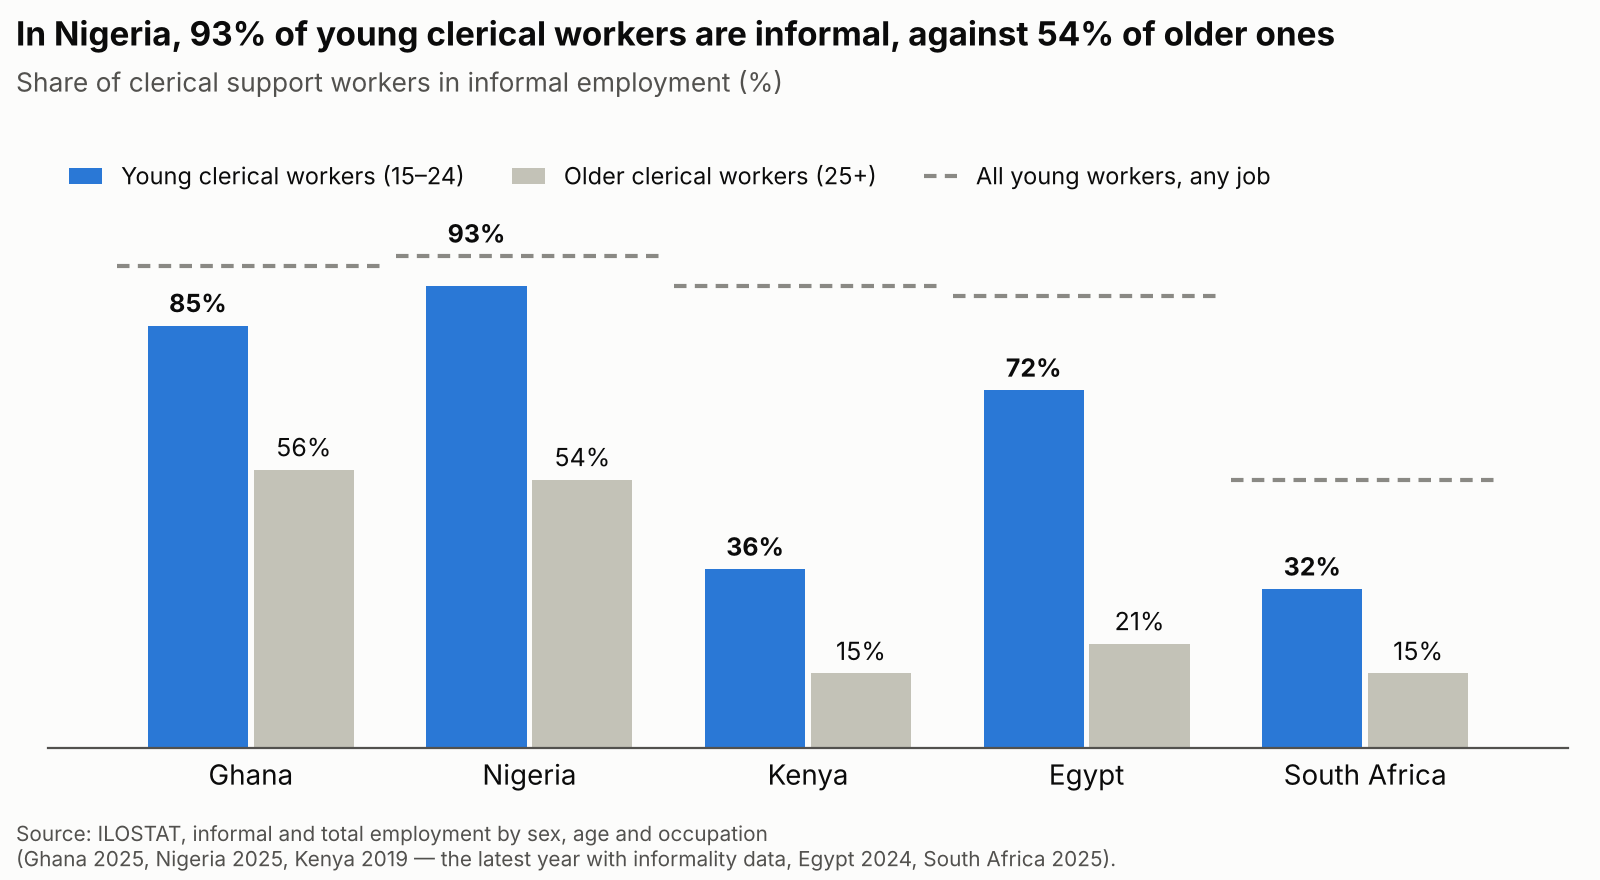
In every country, young clerical workers are far more likely than older ones to be informally employed. In Ghana and Nigeria, an office job only modestly lowers a young worker’s chance of informality compared with young workers as a whole. Any displacement from these jobs would fall mainly on people without a contract or social protection.
What this means for education and youth employment
For young people in these five countries, the near-term risk is less the loss of today’s jobs than the narrowing of one route into formal work.
- Skills systems. Courses that prepare young people for office administration, bookkeeping and data entry are training them for the most exposed occupations. They should pair those skills with client-facing, judgement-heavy and AI-assisted work.
- Young women. Their routes into formal work run disproportionately through clerical jobs, so the gender gap in exposure needs watching, above all in South Africa and Egypt.
- Protection. Most young clerical workers in Ghana, Nigeria and Egypt are informally employed, so any displacement would fall on people without social protection.
- The majority. For the 21–29% of young workers in Ghana and Nigeria in service and sales work, much of it trade, AI is more likely to arrive as tools than as a replacement. Access to devices, data and skills will decide who benefits.
- Better data. Labour force surveys should publish youth employment by detailed occupation, so exposure can be measured directly rather than by major group.
Limitations
- Major groups only. Exposure varies widely within groups: a young accountant and a young primary teacher are both “professionals”. The tiers are indicative.
- Exposure is not impact. Actual effects depend on adoption, which electricity, broadband, cost and skills hold back in all five countries.
- Global task scores. The index scores tasks as generally performed; the same job may involve different tasks in Accra, Lagos or Johannesburg.
- Survey differences. Years, surveys and classifications differ between countries, and Kenya’s latest data are from 2021 (2019 for informality). Comparisons are approximate.
- Employment only. The analysis covers young people in work, not those who are unemployed or not in employment, education or training.
How AI was used. This analysis was produced with Claude, an AI model made by Anthropic, under the author’s direction. The author is responsible for the content.
Role. The author set the question and scope, decided the method, and approved the data sources and countries. Claude wrote the Python code that reads the ILO index from the working paper and processes the ILOSTAT files, and drew the charts.
Verification. The code reproduces the ILO’s own count of 112 exposed occupations and re-applies the paper’s category rules to every occupation. Headline figures were recomputed by a separate script that reads the raw ILOSTAT files directly, and cells ILOSTAT flags as unreliable are marked or avoided.
Limitations. AI-written code can contain errors that checks miss. The full notebook and data are published so that anyone can rerun the analysis and check the results.
Sources, data and code
- ILOSTAT, Employment by sex, age and occupation (thousands), annual and Informal employment by sex, age and occupation (thousands), annual, downloaded 1 October 2026.
- Gmyrek, P., Berg, J., Kamiński, K., Konopczyński, F., Ładna, A., Nafradi, B., Rosłaniec, K. and Troszyński, M. (2025). Generative AI and Jobs: A Refined Global Index of Occupational Exposure. ILO Working Paper 140. Annex Table A1.
- ILO (2026). Youth unemployment rises as young people face a harder road to decent work, news release on Global Employment Trends for Youth 2026, 11 August 2026.
The Python notebook, data files and charts behind every figure here: download the code and data (zip).
More in this series: Fewer users, more coursework: how people in African countries use AI and The graduate squeeze: young graduates, unemployment and AI in Africa.